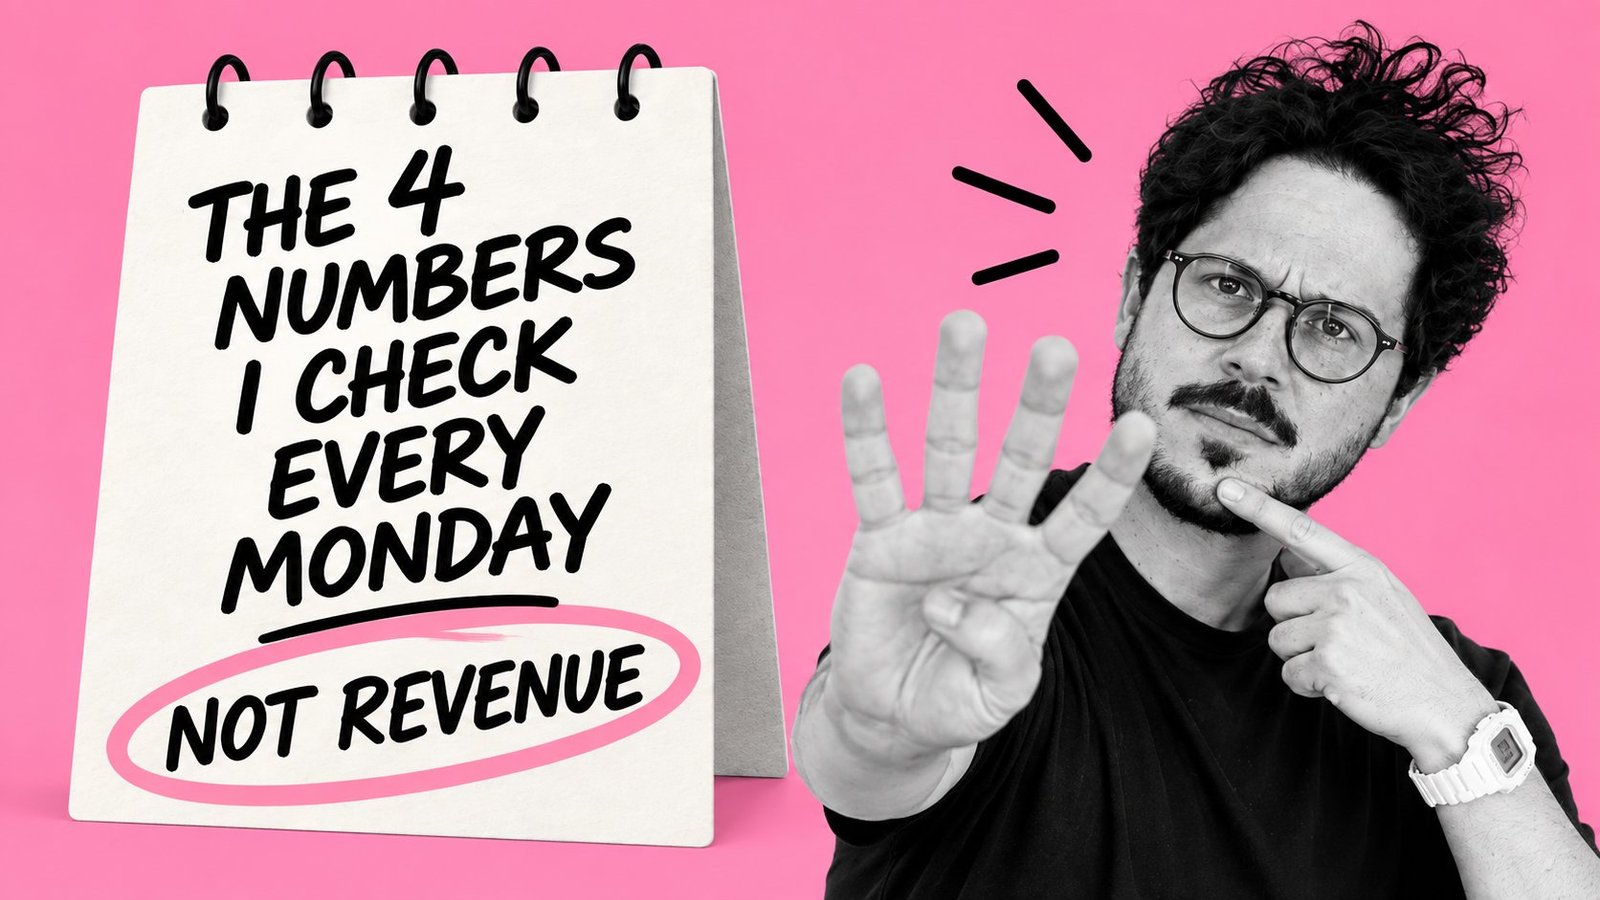
Revenue tells you how big your business is. It says nothing about whether it's good. Every Monday morning, before the week starts, I check four numbers that actually answer that second question — and revenue isn't one of them.
Revenue's the number everyone already knows — you don't need a calculator to tell you what you sold last week. The four I actually check are the ones nobody's talking about, and they're the ones that tell me whether the business is healthy or just busy.
Owners conflate size and health constantly — not because they're careless, but because revenue is the one number you already know without doing any work. The other four take fifteen minutes with a calculator. Revenue takes zero.
In how to value a small business, I walked through two composite businesses with the same $240,000 in earnings that were worth $624,000 and $480,000 respectively — same money, wildly different outcomes, depending on how the business was actually built. Weekly health works the same way. Two businesses can post identical revenue and be in completely different positions the moment something goes wrong. The only way to know which one you're running is to check underneath the top line.
The figures throughout this piece are illustrative composites, not real business data — built to demonstrate the framework, not to represent an actual company.
So here's what I actually check instead of revenue, and then I'll run a real business through all four so you can see how it actually plays out.
1. Margin — What I Actually Keep
A business that keeps 25 cents of every dollar is healthier than one that keeps 8 — no matter which one is bigger.
This is the same lens as Seller's Discretionary Earnings: net profit plus owner compensation, divided by revenue. Under 10% and you're thin — one bad supplier increase, one slow season, and you're underwater. Over 20% and you've got real cushion. Revenue can climb every year while margin quietly shrinks, and it'll still feel like growth. It isn't. It's the same problem, just wearing a bigger number.
2. Cash Runway
How many months could you keep the lights on if revenue stopped today? Not slowed — stopped.
Three weeks of runway means you're one bad stretch from panic, and your income statement will never tell you that, because income statements don't measure fear. Three to six months buys you the ability to treat a bad month like a bad month instead of an emergency. Profit on paper and cash in the bank aren't the same thing — and the gap between them is exactly where businesses die. Run your own cash runway here.
3. Customer Concentration
Ask yourself this one honestly: if your biggest customer called tomorrow and left, would you be fine, or would you be in trouble?
If the answer is "trouble," you don't actually have a customer. You have a dependency wearing a customer's name tag. Revenue spread across fifty accounts behaves nothing like the same revenue sitting in two or three. Cross 15–20% from any single customer and the risk compounds fast from there. Check your own concentration risk here.
4. Break-Even Distance
This is the one almost nobody checks, and it might be the most honest number on the list.
It's the gap between where your costs stop eating your revenue and where your revenue actually sits. Run 40% above break-even and a rough quarter is survivable. Run 5–10% above it and one slow month tips you into a loss. The distance between your break-even point and your actual revenue is the real measure of how much bad luck your business can absorb — and most owners have no idea what that distance actually is. Find your break-even point here.

Running One Business Through All Four Numbers
Here's what this actually looks like with real math, using a composite landscaping business.
Revenue: $650,000 a year.
Margin. Net profit is $95,000, and the owner pays themselves $55,000. SDE is $95,000 + $55,000 = $150,000. Margin is $150,000 ÷ $650,000 = 23.1%. That's solidly healthy — over the 20% line.
Cash runway. Monthly operating expenses run $40,000. The business has $140,000 sitting in the bank. That's $140,000 ÷ $40,000 = 3.5 months of runway. Comfortably inside the three-to-six-month range.
Customer concentration. The largest client — a property management company with several accounts — brings in $70,000 a year. That's $70,000 ÷ $650,000 = 10.8% of revenue. Under the 15% threshold, so no single relationship can sink the business.
Break-even distance. Fixed and variable costs mean the business needs $520,000 in revenue just to break even. Actual revenue is $650,000. That's $650,000 ÷ $520,000 = 1.25, or 25% above break-even. Solid, not spectacular — enough to absorb a rough quarter without panic.
Four numbers, four green lights. This business does a fraction of what a $2M revenue business might post, and it's in a stronger position than plenty of businesses doing three times its sales.
Same Revenue, Different Story
Now take a second composite business — a boutique marketing agency, also doing $650,000 a year.
Net profit here is $40,000, with $50,000 in owner compensation. SDE is $90,000. Margin is $90,000 ÷ $650,000 = 13.8% — thinner, but not alarming on its own.
Monthly expenses run $48,000, and the business keeps $60,000 in reserve. That's $60,000 ÷ $48,000 = 1.25 months of runway — barely five weeks.
One client, a large retainer account, brings in $260,000 of the $650,000 total. That's 40% of revenue sitting with a single customer.
Break-even sits at $610,000. Actual revenue of $650,000 is only 1.07× break-even — 7% above the line.
Same $650,000 on the top line as the landscaping business. But this one is thin on margin, three weeks from being unable to make payroll if revenue paused, one client renewal away from losing 40% of its income, and one slow month away from an actual loss. Nothing on an invoice or a bank statement labeled "revenue" would tell you that. You'd have to check underneath it — which is exactly the point.
Why Revenue Wins by Default
None of this is because revenue is a bad number. A business needs it to exist. The problem is that revenue is effortless — it's the number that requires nothing but reading a receipt total — while these four all demand you sit down and actually do something. So revenue wins the popularity contest by default, every time, even though it's the worst number in the building for judging whether things are actually okay.
Revenue answers "how big." These four answer "how healthy." When you're the one who actually has to survive a bad month, "how healthy" is the only question that matters.
What Good Actually Looks Like
Roughly: SDE margin in the high teens or better, three-plus months of runway, no single customer past 15%, and real distance — not a sliver — above break-even. The landscaping example above hits all four. The marketing agency example hits none of them, despite identical revenue.
Hit all four and a modest-revenue business can be genuinely bulletproof. Miss two or three and a big, growing top line can be quietly hiding a business that's one disruption from real trouble. Revenue alone can't tell you which business you're actually running. These four can.
How Often Should You Actually Check These?
Weekly is the right cadence for most owner-operated businesses — often enough to catch a problem while it's still small, not so often that you're reacting to daily noise. Margin and break-even distance move slowly and are worth a monthly deeper look; cash runway and customer concentration can shift fast enough that a weekly glance genuinely matters, especially in a business with a handful of large accounts or seasonal swings.
Frequently Asked Questions
What financial metrics should a small business owner check weekly?
Margin (what you actually keep, not just revenue), cash runway, customer concentration, and distance above break-even. Together they show business health in a way revenue alone can't.
Is revenue or profit more important for a small business?
Profit — specifically what you keep after real costs, including your own compensation — is a far better health indicator than revenue, which only shows scale.
What's a healthy profit margin for a small business?
It varies by industry, but as a general owner-operator benchmark, SDE margin in the high teens to 20%+ of revenue indicates real resilience. Below 10% leaves little room to absorb a bad month.
How much cash runway should a small business have?
Three to six months of operating expenses in reserve is a common benchmark. Less than a month leaves almost no room to absorb a disruption; six months or more generally means a business can weather a genuinely bad quarter without structural damage.
Run Your Own Numbers
Profit Lights has a free Business Health Check that scores your business across these exact four signals in about two minutes, no financial documents required. It'll show you where you're genuinely strong and where you've got real exposure.
Profit Lights provides an educational estimate only and does not provide a certified, professional, accounting, tax, legal, or investment assessment.
About Me
I'm Michael Philippou, co-founder of Big Love, a plant-based ice cream business in Santa Monica I've been running with my wife Victoria for over ten years. Before ice cream, I was a lawyer. I write about the real, unpolished lessons of running a small business — no gurus, no hype, just what's actually worked and what hasn't — at profitlights.com, where you'll also find a few free tools and the rest of my writing. You can find more of these stories on my YouTube channel, Real Business Real Lessons, or connect with me on LinkedIn.
Want to know how your business is actually doing? Start with the free Business Health Check — a couple minutes of questions and your email gets you a real score. Or dig into the other four: Valuation Estimator, Cash Runway, Customer Concentration Risk Checker, and Break-Even Calculator.